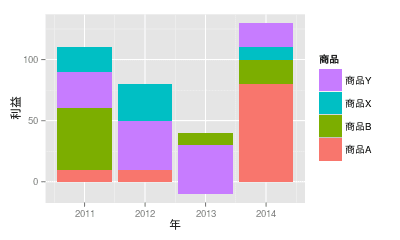
この表をExcel やCalcで棒グラフにするとこんな風になります。正の値と負の値を別々に積み上げます。(Calcで描いたものです。)
|
ggplotの棒グラフは基本的にカウントデータを前提にしたものなのでしょうから、最小値が0でない場合は警告を出しています。
> profit.ldf <- melt(profit.tbl, value.name = "利益")
> qplot(data = profit.ldf, x = 年, y = 利益, fill = 商品, geom = "bar",
+ stat = "identity", position = "stack") +
+ guides(fill = guide_legend(reverse = TRUE))
Warning message:
In loop_apply(n, do.ply) : Stacking not well defined when ymin != 0
> qplot(data = profit.ldf, x = 年, y = 利益, fill = 商品, geom = "bar",
+ stat = "identity", position = "stack") +
+ guides(fill = guide_legend(reverse = TRUE))
Warning message:
In loop_apply(n, do.ply) : Stacking not well defined when ymin != 0

私が必要としているのはExcel風の棒グラフなのでExcelで描けばよいのですが。
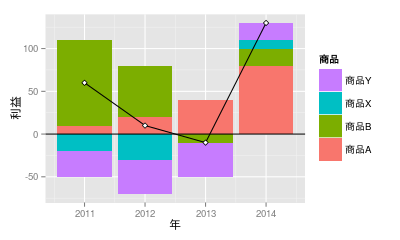
結局、積み上げの部分を正と負に分割して作成して合成しました。レイヤーって便利です。やっぱり警告も出ますが、意図したようになったわけだから無視します。でも、私の知らない他の良い方法がありそうな気もするのです。
> fig <- ggplot() +
+ #正の積み上げ
+ geom_bar(data = subset(profit.ldf, 利益 > 0), aes(x = 年, y = 利益, fill = 商品),
+ stat = "identity", position = "stack") +
+ #負の積み上げ
+ geom_bar(data = subset(profit.ldf, 利益 < 0), aes(x = 年, y = 利益, fill = 商品),
+ stat = "identity", position = "stack") +
+ #合計の折れ線
+ geom_line(data = melt(xtabs(利益 ~ 年, data = profit.ldf)), aes(x = 年, y = value),
+ color = "black") +
+ #合計の点グラフ
+ geom_point(data = melt(xtabs(利益 ~ 年, data = profit.ldf)), aes(x = 年, y = value),
+ color = "black", pch = 23, bg = "white") + #ggplotでもpch使えるんだ!
+ #x軸
+ geom_hline(yintercept=0, color = "black")
> fig + guides(fill = guide_legend(reverse = TRUE)) #凡例を逆転
Warning message:
In loop_apply(n, do.ply) : Stacking not well defined when ymin != 0


